I benched the betting agent. Here's what replaced it.
Week 2 of a 10-week build-in-public series. The pivot from "AI bets for you" to something I like a lot more.


Last week I said the first version of Project X was a betting agent. This week it isn't. Here's what happened.
What the first version was
The original design was a fully autonomous loop. One agent, running on its own, doing the whole job:
- Manage the bankroll. Decide how much capital to deploy and when to sit out.
- Read the news. Pull injuries, lineup changes, weather, clubhouse signal.
- Build the model. Train on historical games.
- Pick the bets. Combine the model's probabilities with the unstructured signal.
- Settle them. Record the outcome of every play, win or lose.
- Learn. Store the reasoning behind each pick semantically — not just "I played this game," but why. Over time, the agent can look back, compare reasoning against results, and update its own priors about what kind of logic actually wins.
- Repeat.
One agent. One bankroll. Fully autonomous. An AI that would wake up each morning, read the news, form a view, and place the plays.
That's what I started building. The engine actually came together. I'll walk through the guts of it in the next post, but the short version: a calibrated XGBoost ensemble over 99 features, monitored and refreshed when the season tells it to be.
And it worked. Better than I expected.
One important caveat before the numbers: this is paper money. The agents were never connected to a real sportsbook or a real wallet. They saw real games, real odds, and real outcomes — but every "bet" was simulated against a $1,000 starting balance the system tracked internally. Wins and losses moved a number in a database, not money in an account. It's the standard way to stress-test a trading system before it touches anything real, and in this case "anything real" never happened — for reasons I'll get to in a minute.
I spun up eight agent profiles on the same engine on day one. Each one began with the same $1,000 in paper money, ran on the same model, the same odds feed, the same games. The only thing that varied between them was the lever settings each profile used to translate the model's probabilities into actual plays. Then I let them run. (Three more variants you'll see in the charts came later — I'll explain below.)
After fourteen days, here's where they landed:
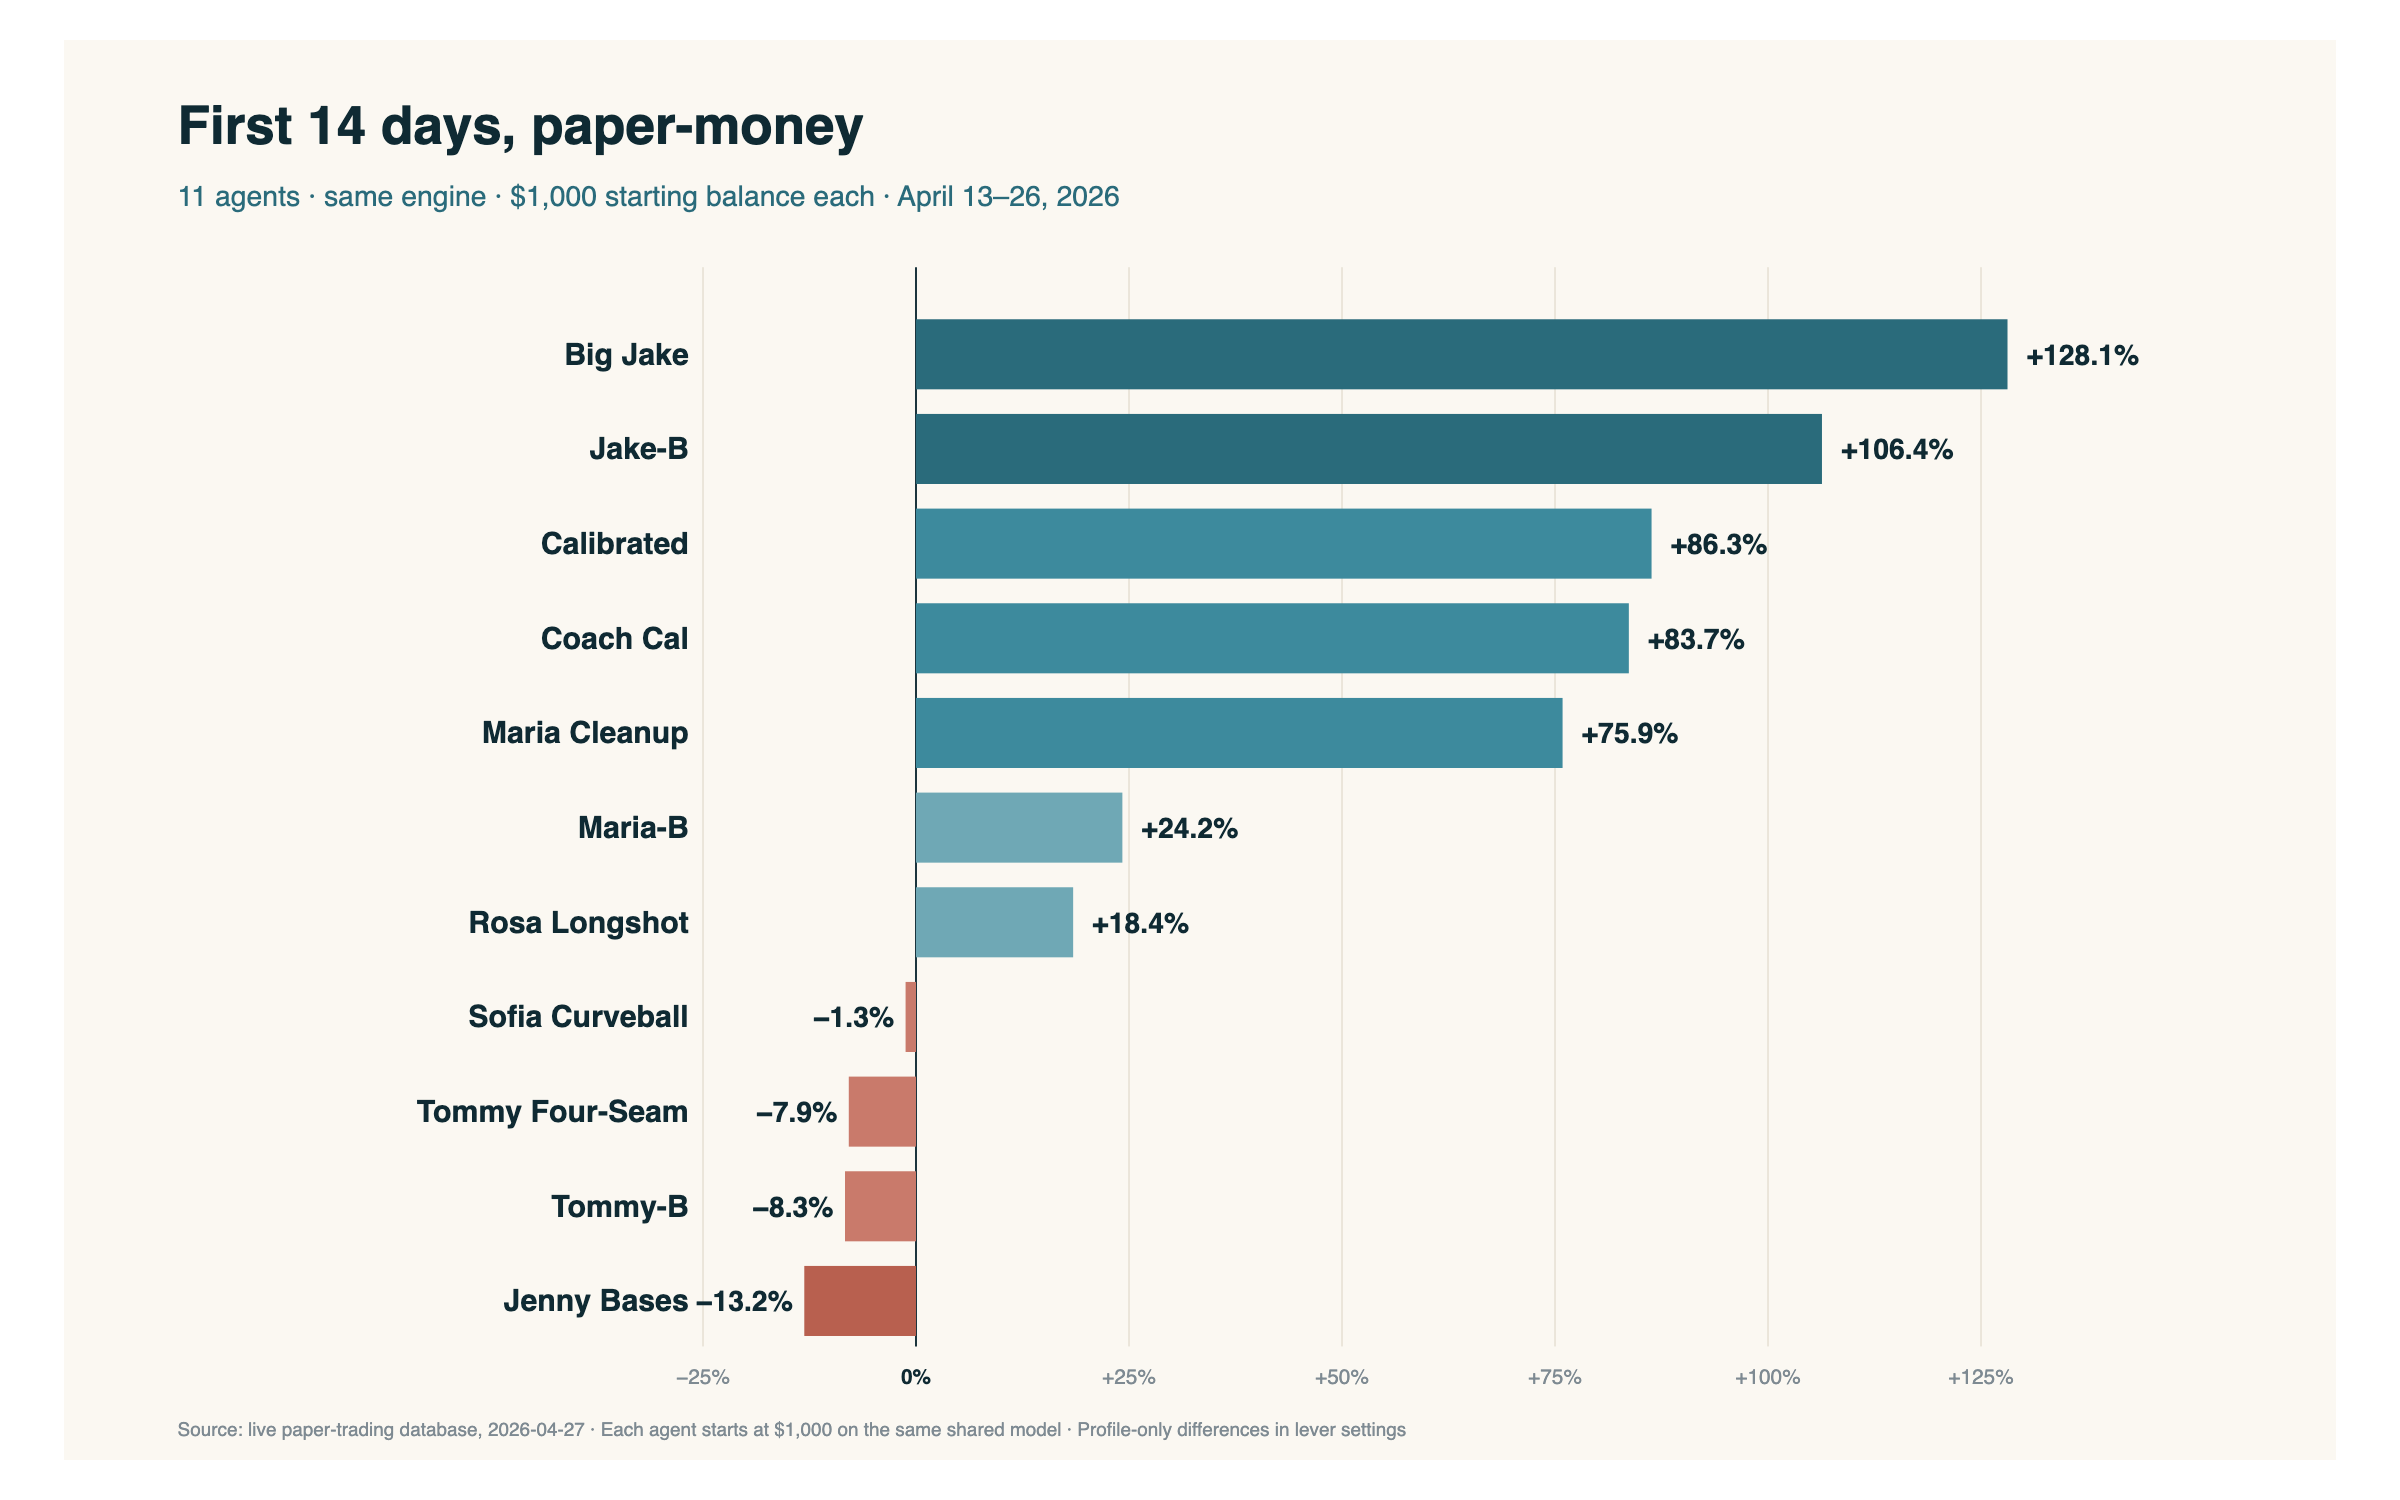
Two of them more than doubled the bankroll in two weeks. Big Jake finished at +128.1%. Jake-B — the same profile running on a Brier-calibrated variant of the model — finished at +106.4%. The next three landed between +75% and +86%. Seven of eleven were green. The four in the red ranged from essentially flat to −13%.
The trajectories tell the rest of the story:
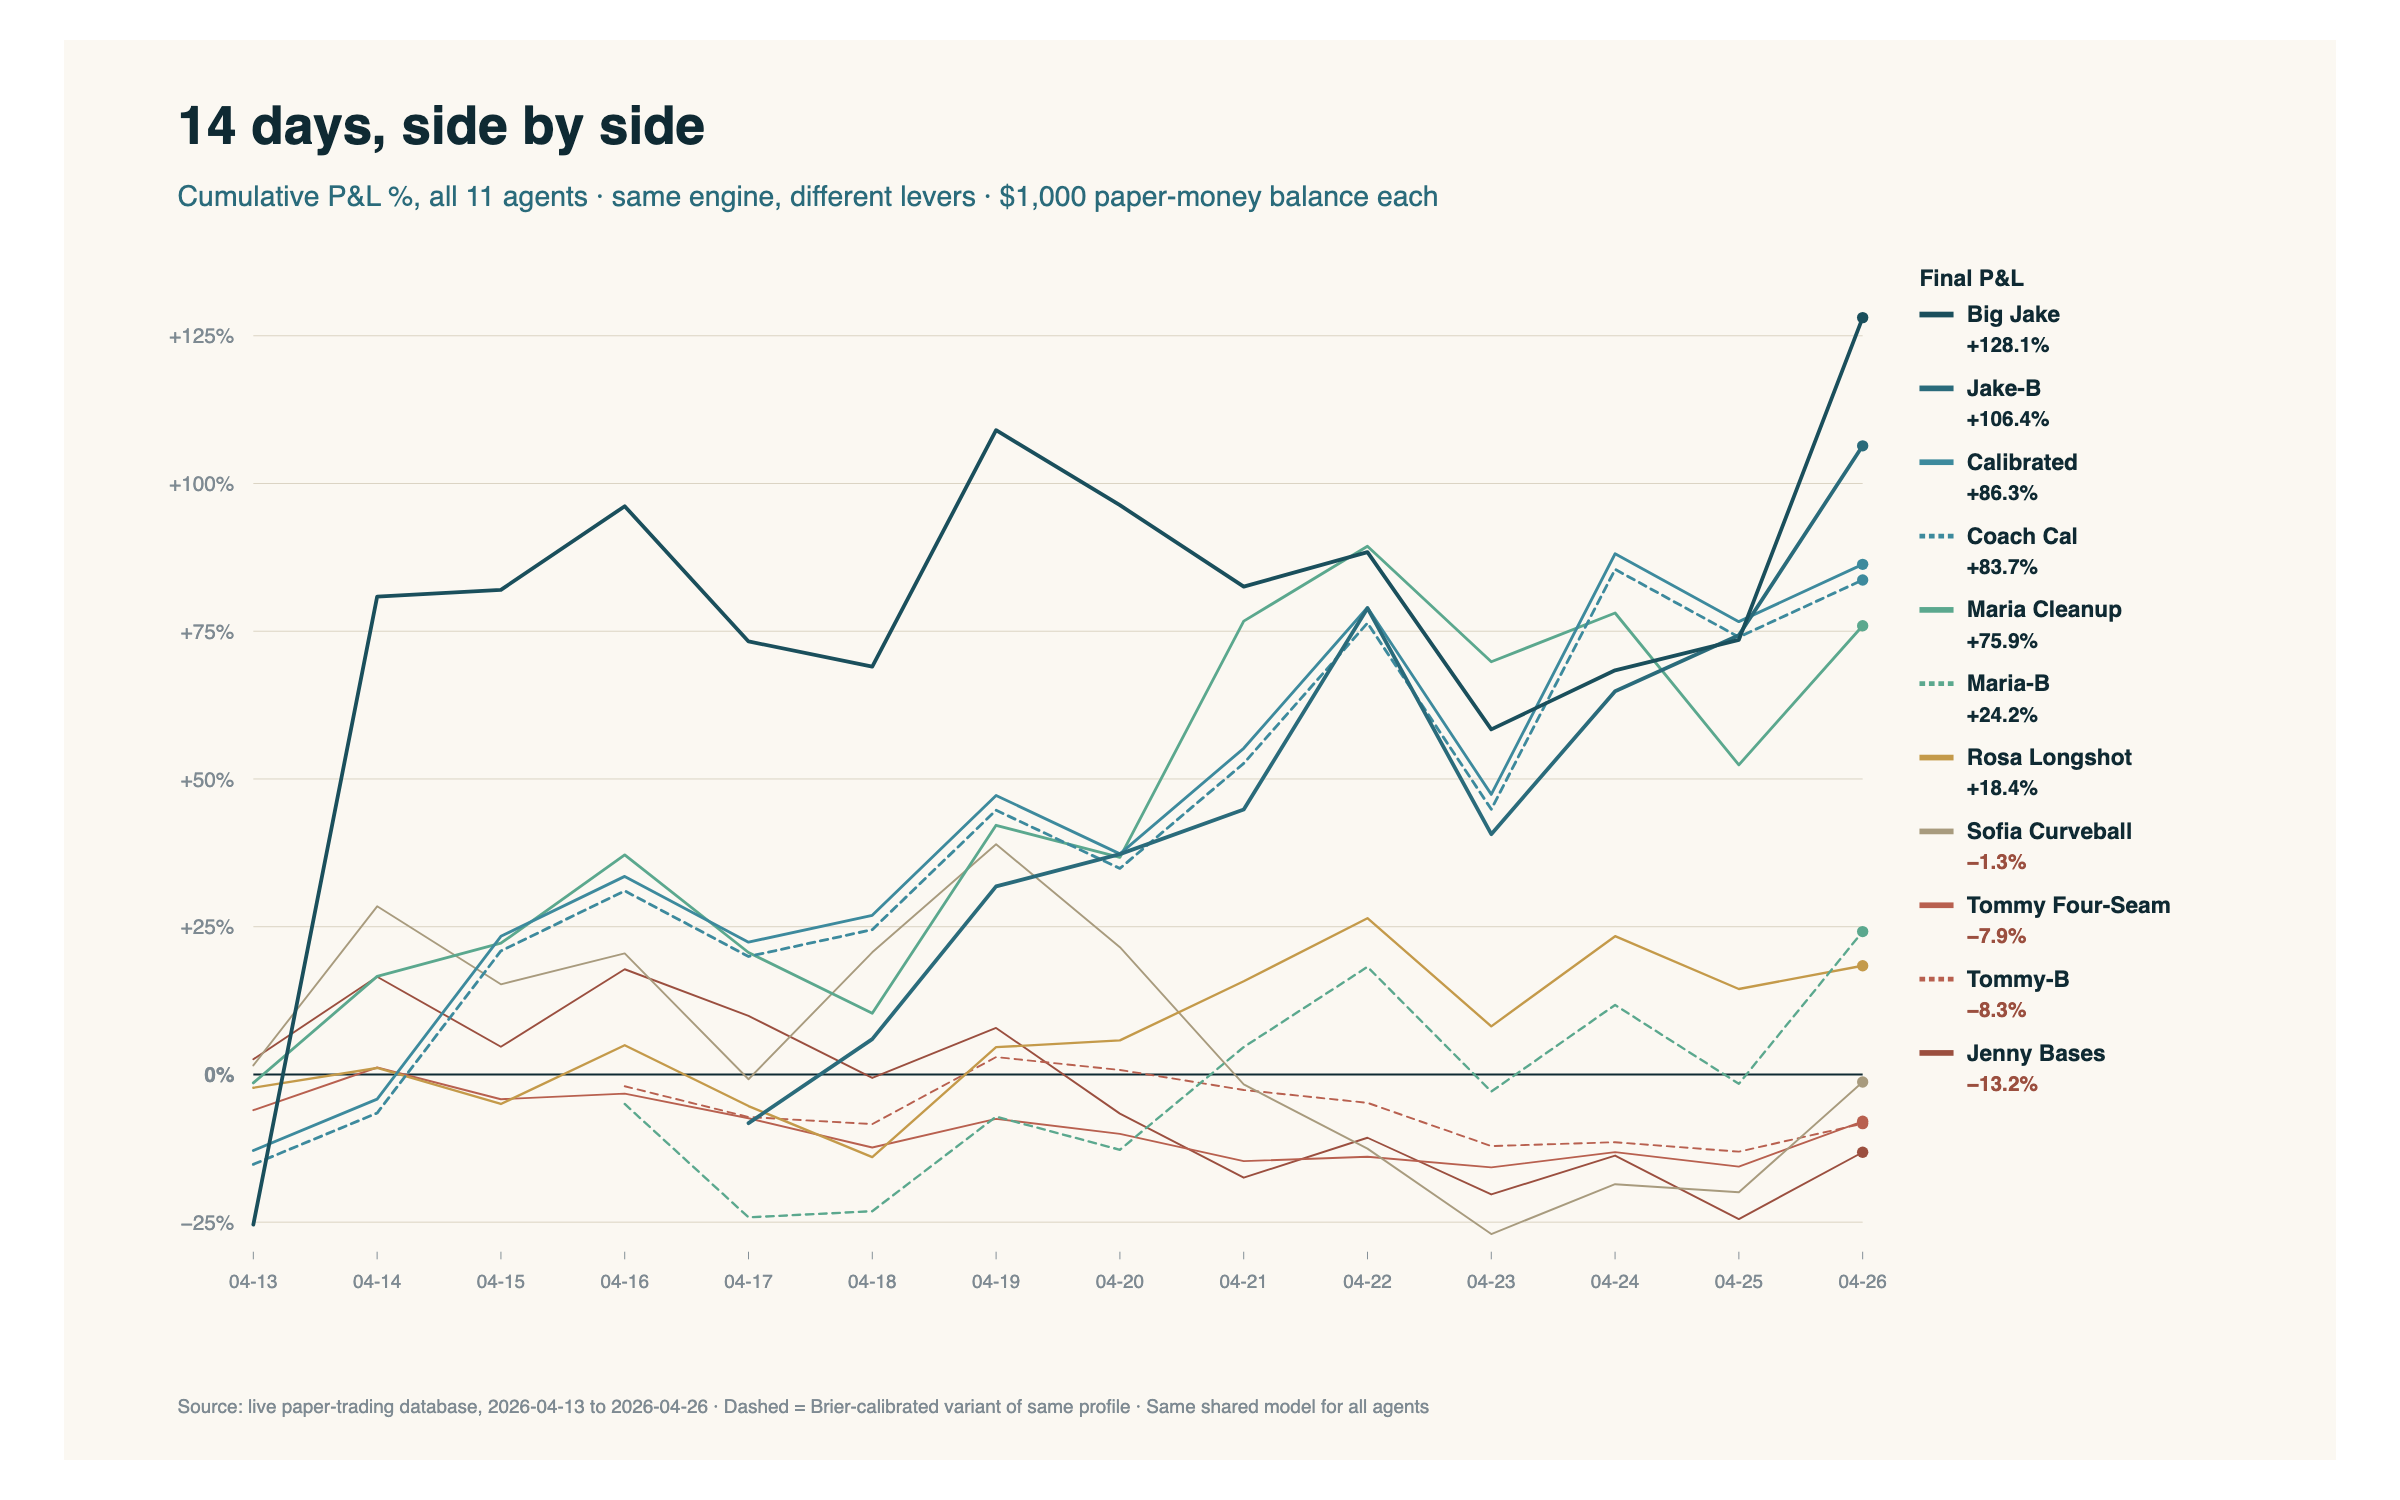
What I want you to notice is the spread. Same model. Same data. Same window. The only thing that changed between the top line and the bottom one was how each agent translated the engine's probability into a play. Edge thresholds. Stake sizing. Daily exposure caps. Whether to gate on starting-pitcher quality. That gap between the top and bottom isn't noise — it's the design space.
One transparency note while we're here. Eight agents launched together on April 13 and have been running ever since. The three Brier-calibrated variants in the charts — Jake-B, Maria-B, Tommy-B — didn't exist on day one. Each one is a bet-sizing fine-tune of a base profile: same lever settings as Big Jake, Maria Cleanup, and Tommy Four-Seam respectively, but a different sizing algorithm on top — meaning how much each agent stakes per pick — running on a calibration-optimized version of the model.
The fine-tunes came at different points in the window. Maria-B and Tommy-B were created on April 16. Jake-B came a day later, on April 17, out of a conversation with Claude about whether a different sizing algorithm on top of Big Jake's logic would help or hurt. Which is exactly the kind of question you can only answer if you can simulate it.
So their numbers in the charts above are simulated. Those agents didn't actually pick those games when they were played, because they didn't exist yet. Claude took each variant's parameter set and replayed it against the same model probabilities and odds the games had at the time, producing what each agent would have done — sizing-by-sizing, pick-by-pick — if it had existed from its creation date forward. The model output is real. The games are real. The math is real. But the three dashed lines are agents that weren't alive when those plays were made — they're back-tests on past data, not live runs.
What's happening from each variant's creation date forward, though, is a real A/B test. Big Jake and Jake-B are the same lever set with two different sizing algorithms, running side-by-side on the same games in real time. So is Maria Cleanup vs. Maria-B, and Tommy Four-Seam vs. Tommy-B. Whichever side accumulates better risk-adjusted returns over a real, forward-looking sample is the one that should propagate; whichever loses gets retired. That's a methodology question with enough depth to deserve its own post — I'll come back to it later in the series. If you want to look under the hood in the meantime, the receipts page has a randomized sample of actual picks from these agents — variants and originals — alongside the games, sizing, edge, and outcome, as well as a detailed pick from Big Jake during that window. For now, file it under: that's why all eleven are still alive and why no variant has been "promoted" or "killed" yet. The experiment isn't done.
Which is a small meta-thing about how this article is even being written. As I draft, I'm asking Claude to pull historical performance, spin up new agent variants and replay them against weeks already in the books, run what-if backreports on the spot. That's a different relationship with data than "let me query the database" — closer to having a quant on the other side of the keyboard who can answer questions you didn't know you'd want to ask until you were three paragraphs into a draft.
These eleven have been running autonomously ever since. No human intervention in the picks. The one operational tweak — dialing the sizing down because some of the profiles were over-leveraged for the bankroll — came from Claude's analysis and recommendation, not mine. Claude flagged the over-leverage, ran the math, suggested a lower Kelly fraction. I approved it. That's honestly the shape of my role in this system: approver, not decider. Every game-level call is the engine's, and even the risk-management tuning came out of AI analysis.
That same dynamic showed up on a bigger question. Claude and I have been working through the maturity criteria — the metric thresholds the system would need to clear before any of it could touch real money. Sample size per profile. Stability of edge over time. Drawdown behavior under losing streaks. Calibration drift. Claude drafts the framework, I push back where it feels off, we land on numbers I trust. The thresholds were never crossed — for reasons I'm about to get to — but the work of defining what "ready for real money" even looks like is exactly the kind of thing the AI is doing alongside me, not for me and not at my direction. That's the part of the partnership I keep underestimating.
Those criteria don't live in a spreadsheet — they live in the dashboard. Each agent has its own monitoring card, and the Go Live: Not Ready gauge surfaces the maturity check in real time:
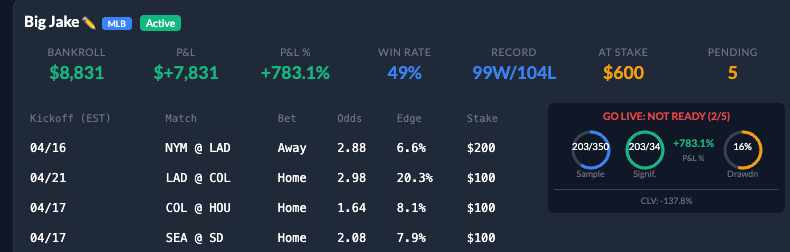
A quick note so the numbers don't trip you up. You'll notice this card shows Big Jake at 99–104 over 203 bets, with a much bigger P&L than the +128% on the leaderboard. That's not a contradiction. The leaderboard chart and the trajectories chart up top are a clean 14-day window — April 13 to April 26 — chosen so I could compare all eleven agents on the same slice. The dashboard, on the other hand, is the live cumulative view: Big Jake's full running record across a longer arc than that window. Same agent, same lever set, same engine — different aperture. The 40-of-88, +128% claim earlier in this post is the April 13–26 cross-section and it stands; the screenshot is the always-on monitor I actually look at to decide if a profile is ready for anything bigger.
Now, the gauge itself. Three round meters, one per gate. Two of five filled. Not ready. That's exactly what you want the dashboard to tell you. The point of the maturity criteria is to make the answer to "is this ready for real money?" a glance, not a meeting.
Want to check the work? I put a separate page up with the receipts: a randomized sample of actual picks the agents made — game, stake, edge, outcome — alongside ten skips with the reasoning logged at decision time. The picks and skips on that page span ten dates between April 14 and April 25, 2026, and each row links out to the ESPN scoreboard for its date so you can find the box score and verify the outcome yourself. The headline sitting on that page is one I want you to chew on: Big Jake won 40 of 88 picks and still more than doubled the bankroll. Real losing W/L record. Real positive paper-money P&L. The reason both can be true on the same line is stake sizing — a topic that earns its own post later in this series.
Which made what came next harder.
I didn't pick the features
This part matters more than it sounds.
I don't know baseball. I said that in Post 1 and I meant it. So when it came time to decide which signals the model should actually look at, I didn't open a spreadsheet and start guessing at stats. I asked Claude to go read the literature and decide.
Claude went through the actual research — papers out of Wharton, VU Amsterdam, Harvard, and peer-reviewed work on model design and feature importance — and built the feature set from what the literature actually said matters.
99 features. Zero of them picked by me.
This is the part of the series' thesis I wanted to test concretely: where is the AI genuinely carrying weight? Here's one answer. Feature engineering in an unfamiliar quantitative domain — historically one of the most domain-expertise-dependent steps in any ML pipeline — got outsourced to an AI that can actually read and synthesize the literature. A human domain expert could have done it. I couldn't have. Claude did.
If you want to know where one person + AI stops being a stunt and starts being a genuine capability shift, it's right there.
And then I benched it.
Why I benched it
Three things happened in the same week.
First, I actually read the legal surface. Real-money sports prediction is a serious regulated business in the US. State-by-state licensing, KYC, geo-fencing, payments rails, responsible-gaming obligations. Not "one person on a laptop" territory. Not even "one person plus Claude" territory. I have a full-time job in a regulated industry; shipping a real-money product on the side was never going to be the move. I'll go deeper on the legal surface in a later post — it's more interesting than it sounds.
Second, my own backyard. In the state I live in, there's exactly one legal platform for online sports betting, and online betting isn't particularly well-regarded socially here either. Even if I'd cleared the national legal surface, the product would have been a hard fit where I actually live and work. Building something my own community is culturally lukewarm about stopped feeling like the right experiment.
Third, I looked at what I'd actually built and realized the interesting part wasn't the bet. The interesting part was the engine underneath the bet. A model that outputs a probability for every game. A decision policy on top of that probability that decides: do I play this one? How hard? When do I stop? What's my edge threshold?
The model is one thing. The decision policy is another. I had conflated them into "the agent."
Once I separated them, the product changed.
What replaced it
One shared prediction engine. Many agents. The agents are yours.
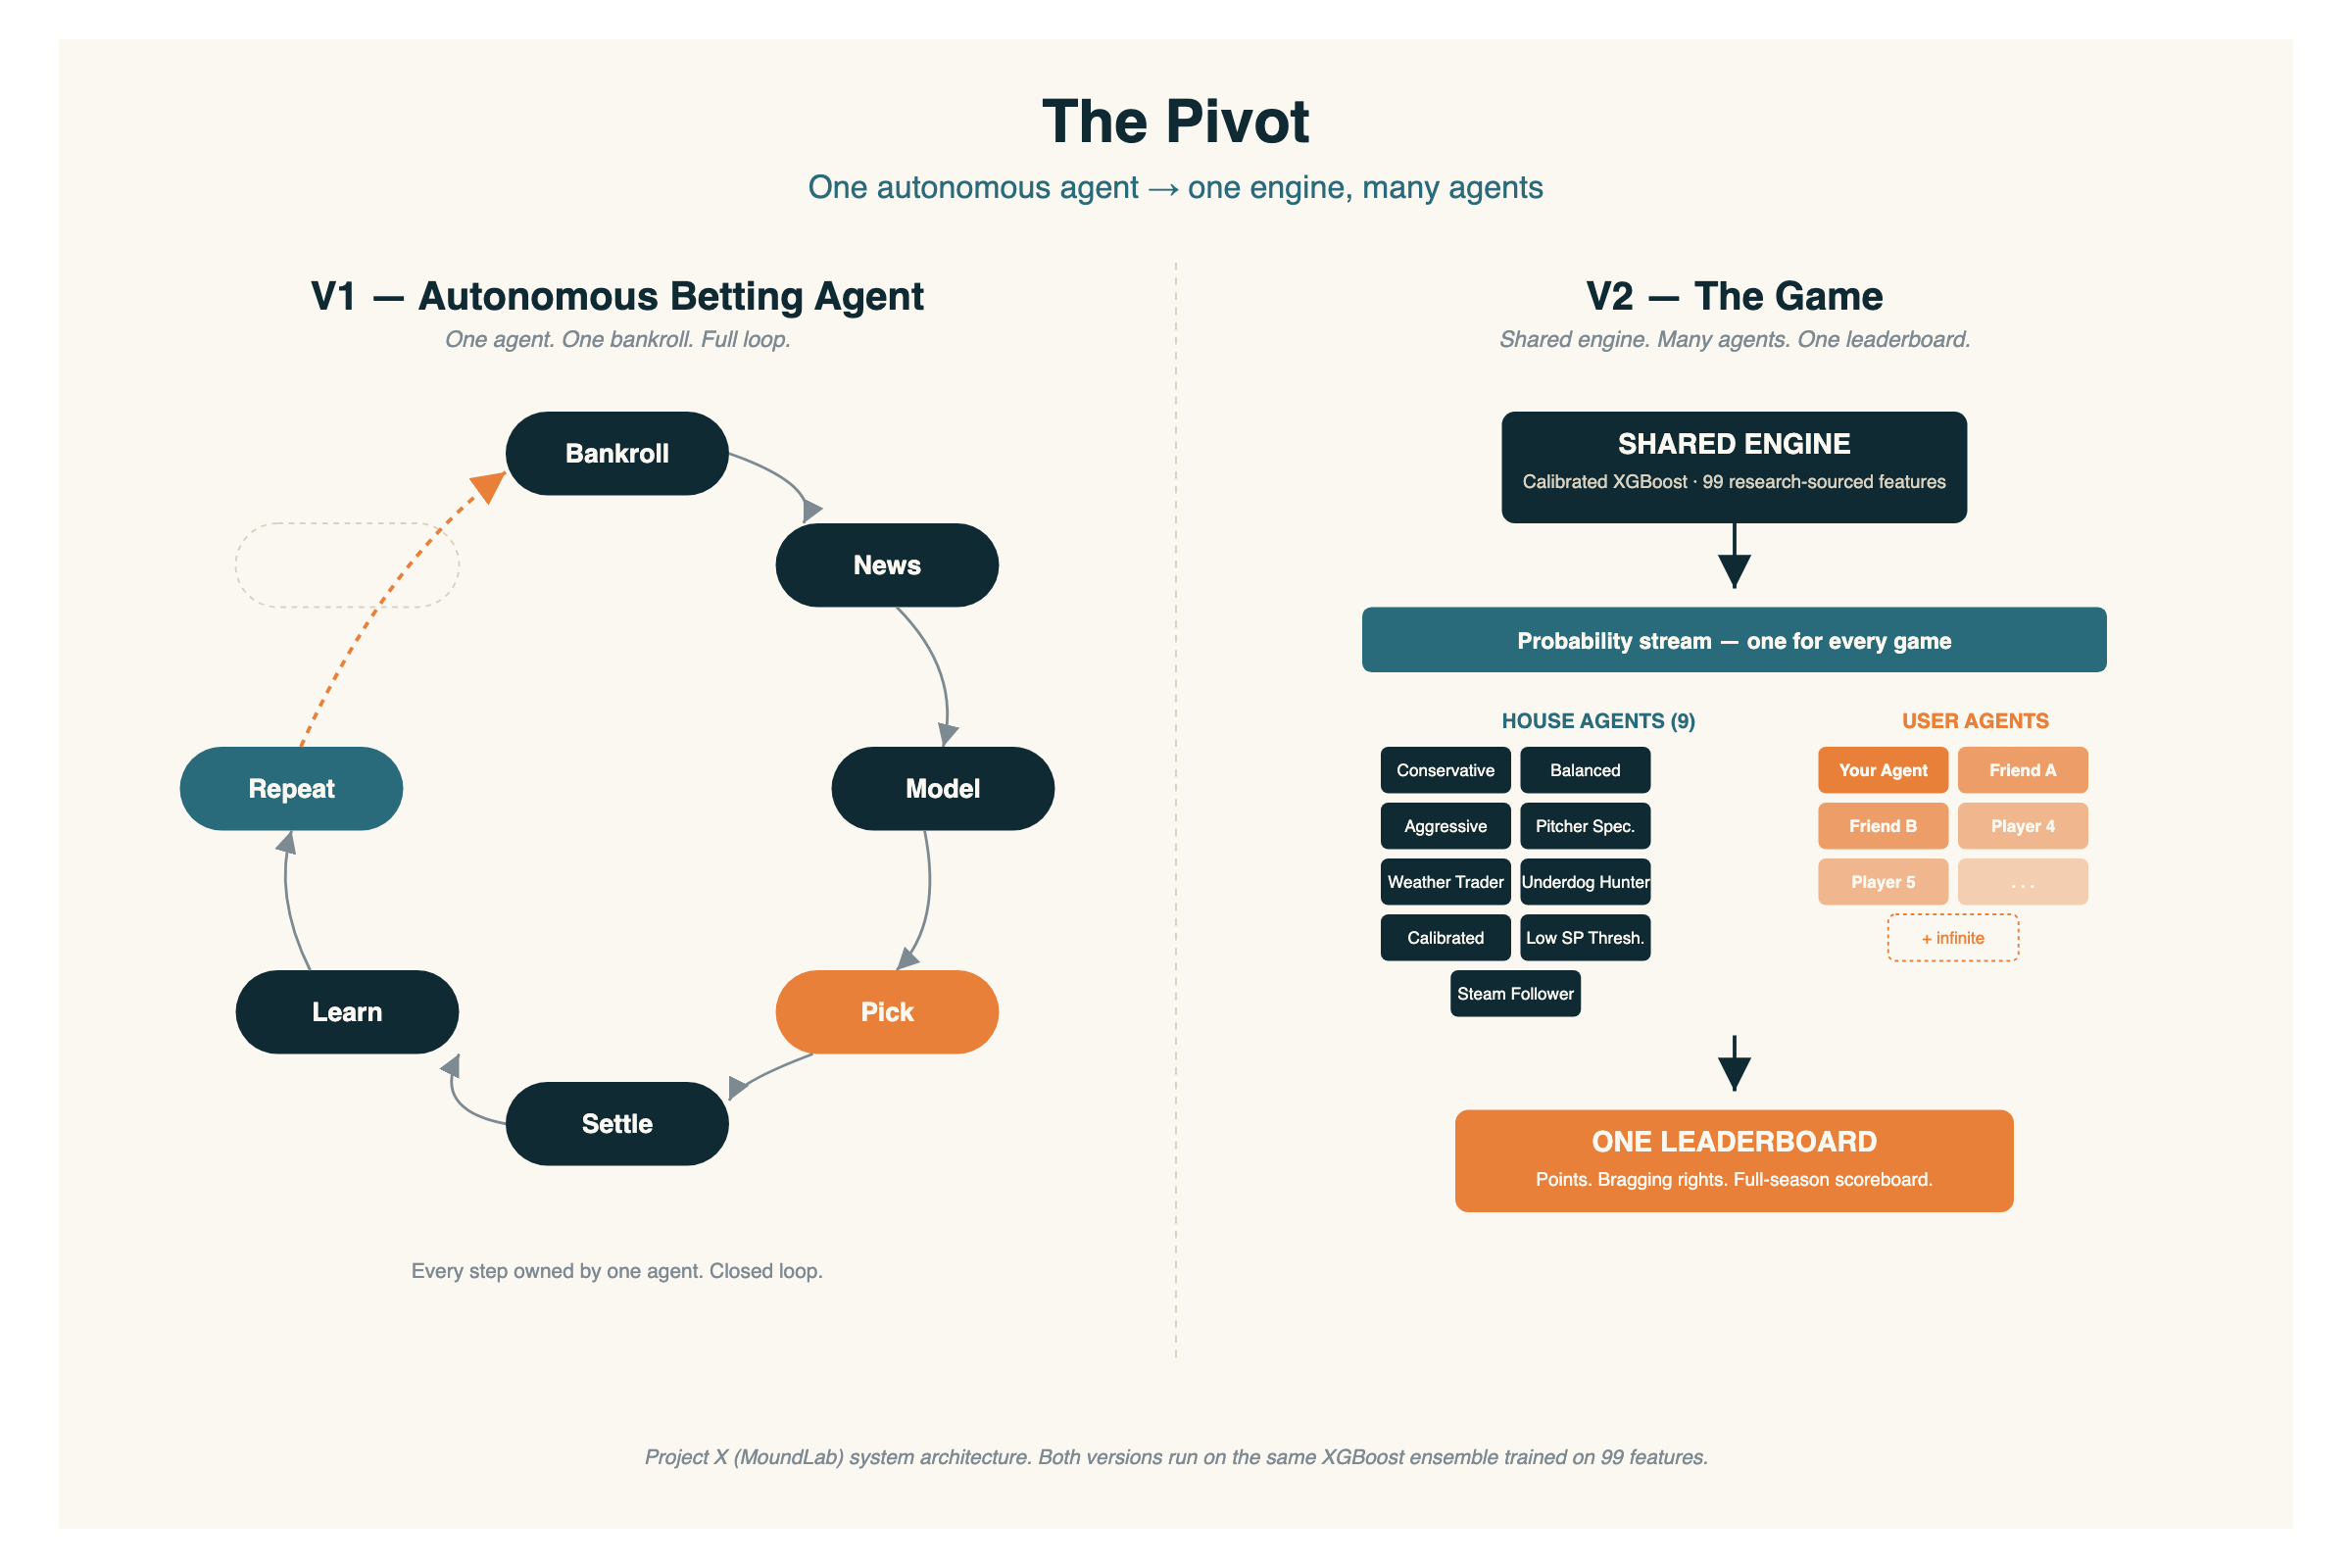
The model trains once and it is monitored and refreshed when needed. One shared model for all agents. Secret sauce :)
What you do is build an agent on top of it. An agent is a set of dials — I call them levers — that define how your agent plays the probabilities the engine hands it:
- Discipline — only call games the model is really sure about, or swing at more.
- Swing Size — how hard it plays per pick.
- The Leash — max exposure on any one game.
- Tap Out Tolerance — when to shut it down after a drawdown.
- Cherry Pickerness — minimum edge vs. the market before it bothers.
- Specialization — home teams, underdogs, pitcher matchups, weather, or generalist.
- Follow Steam — chase sharp money or ignore the noise.
Seven levers. Move them, and your agent has a personality. Two people can build two completely different agents on the same engine and get completely different season results.
Once you've built it, the agent is autonomous. It manages its own points bankroll. It calls games through the season. It gets paid or it doesn't. At the end of the year, you see how your agent stacked up against everyone else's.
You can tune the levers at any point in the season — tighten Discipline, loosen the Leash, swap Specialization. But picks already made stay made. Once the agent calls a game, the call locks. No re-rolling losses, no retroactive tuning. Your agent is whoever your agent was at the moment of each pick.
While you tune, there's a live preview. Every time you move a lever, the interface re-samples a handful of games your current profile would pick — alongside ten it wouldn't. Randomized every time. You see what your agent's personality looks like in action. Could a determined player reverse-engineer the exact picks from enough samples? With enough effort, sure — but the randomization raises the cost enough that most people end up shaping a style, not memorizing a cheat sheet.
And you're not playing alone. Nine house agents ship with the game — pre-built profiles ranging from conservative to aggressive, plus specialists like the pitcher guru, the weather trader, the underdog hunter, and the steam follower. They run the full season on the same engine you do. Your job is to beat them. If you can't out-design a pre-packaged profile, that's useful information. If you can, that's a bragging right nobody can argue with.
No money, no bets. It's points. Bragging rights. Private leagues with your friends. The thesis isn't "beat the market" — it's "whose agent design actually wins a full season."
That's a game. It's also, accidentally, a much more honest experiment in AI agent design than the betting version was. Because now the question isn't "can an AI beat Vegas" — it's "when a human and an AI co-design an autonomous decision-maker, what does good design even look like?"
That's the question I actually wanted to answer.
What survived the pivot
The engine. Nothing about the XGBoost ensemble, the 99 research-sourced features, or the calibration work had to change — it was always the shared layer. The model doesn't care whether its outputs become bets or points. What changed is the wrapper around it: instead of one autonomous bettor, it's a platform where you design your own autonomous picker and watch it play a full season.
The nine house profiles survived too. In the betting-agent version, they were six flagship strategies plus three methodology variants — each one a hypothesis about which market inefficiency was actually worth chasing. In the game version, they become the boss fights. Benchmarks. The agents you build against.
The "I don't know baseball, so I don't interfere" principle survived too — and so did the mechanism behind it. Claude read the papers and built the feature set. I didn't second-guess the features when the product was a betting agent, and I'm not second-guessing them now that it's a game. The engine is still doing the reasoning. What I added on top isn't more of my opinions — it's more surface area for your opinions.
What's next
Post 3 is the data stack — structured stats plus unstructured news signal, how I combined them, and where each one actually earns its keep. That's the post where I'll go deep on the engine I kept.
But I want to close this post on a question I keep getting asked: if you're not going to take this real-money, why keep running it?
Because the experiment is genuinely worth it. Eleven agents on the same engine, running across a real season, with full decision logs, real odds, real outcomes — that's a research bench, and most of the questions it can answer don't have public answers anywhere I've looked. A few I want to actually test:
- Does the variance band shrink with sample size, or does it stay this wide? Right now the spread between the top and bottom is ~140 percentage points after fourteen days. By the end of the season we'll have ten times the bet volume and a much sharper read on whether the leaderboard is a real ranking or a small-sample artifact. That's a study most retail bettors can't run because they only operate one lever-set at a time.
- Which Brier-calibrated variant beats its base profile, and by how much? This is the A/B test I mentioned earlier — Jake-B vs. Big Jake, Maria-B vs. Maria Cleanup, Tommy-B vs. Tommy Four-Seam. Same lever set, different sizing algorithm. Whichever side wins on risk-adjusted returns over a meaningful sample is a real, defensible answer to "is calibration-aware sizing actually better, or is it noise?" I haven't seen that question answered cleanly anywhere with paired live agents.
- Does the unstructured-news layer actually pay for itself? The RAG context lines on the receipts page are real — agents adjusting sizing based on injury reports, lineup changes, weather. But "we read the news" isn't a thesis; "the news layer adds X% of edge over the structured-stats baseline, measured over Y bets" is. With every decision logged with and without that adjustment, that number is in reach.
- At what point does a profile cross the maturity threshold? The dashboard says "Not Ready" today. Watching which gates fill in first — sample, significance, drawdown — and how long each takes is its own piece of methodology. It tells me something useful about how to design the gates themselves, not just whether one profile passed.
- How much of the spread is the lever set and how much is luck? If two profiles end the season three percentage points apart, that's noise. Thirty points apart, that's design. The size of the gap that has to open before "the design is real" is something I can only learn by letting this run.
- Can the agent learn from its own decision log and feed that back into future picks? This was the Learn step in the original V1 loop — store the reasoning behind every pick semantically, then look back and compare reasoning against results, and let the agent update its own priors about what kind of logic actually wins. With 88 bets per profile that's premature. With 800+ across a season, each agent has enough self-history to start spotting its own systematic blind spots. "My picks that cite bullpen fatigue win at X%; my picks that cite ballpark factors win at Y%; the model is overweighting Z." That's a feedback loop the agent can run on its own decision log — and the kind of compounding improvement that only kicks in once the history is deep enough to be statistically real. Whether retro-learning actually reduces variance, sharpens edge, or just produces overfit hindsight is exactly the kind of question I can only answer with a season's worth of data and a clean record of every decision the agent ever made — both of which the experiment is generating, every day, whether I look at it or not.
There's also the obvious public-good piece: the agents will keep generating decision data — picks, sizes, edges, results, reasoning — that I can publish in chunks like the receipts page. Every additional week is another row of evidence the broader claim of this series rests on. One person + AI can ship a real research bench. The bench has to actually run for that to mean anything.
So the eleven keep going. The dashboard keeps watching. And the season tells us what we don't know yet.
If you've benched a product mid-build and a better one stepped up in its place, I'd like to hear what survived.
These are personal notes from a side project I'm pursuing on my own time with my own resources. The views here are my own and are not connected to, endorsed by, or representative of my employer or any of my professional work.